When shall you call it is ice instead of water?
Contents
The state of \(H_2O\) molecules is depicted in Fig. 1 at three different times. In Fig. 1 (a), the overall structure of the system is clearly organized, as demonstrated in Fig. 2. As we increase the temperature of the system, the atoms begin to vibrate and some of the characteristic structures of ice start to break down, as shown in Fig. 1 (b). If the temperature continues to rise, the entire system becomes increasingly chaotic.

Figure 1: Visualization of studied ice Ic at different time stamps: (a) 0, (b) 5000 femtoseconds, and (c) 25000 femtoseconds.
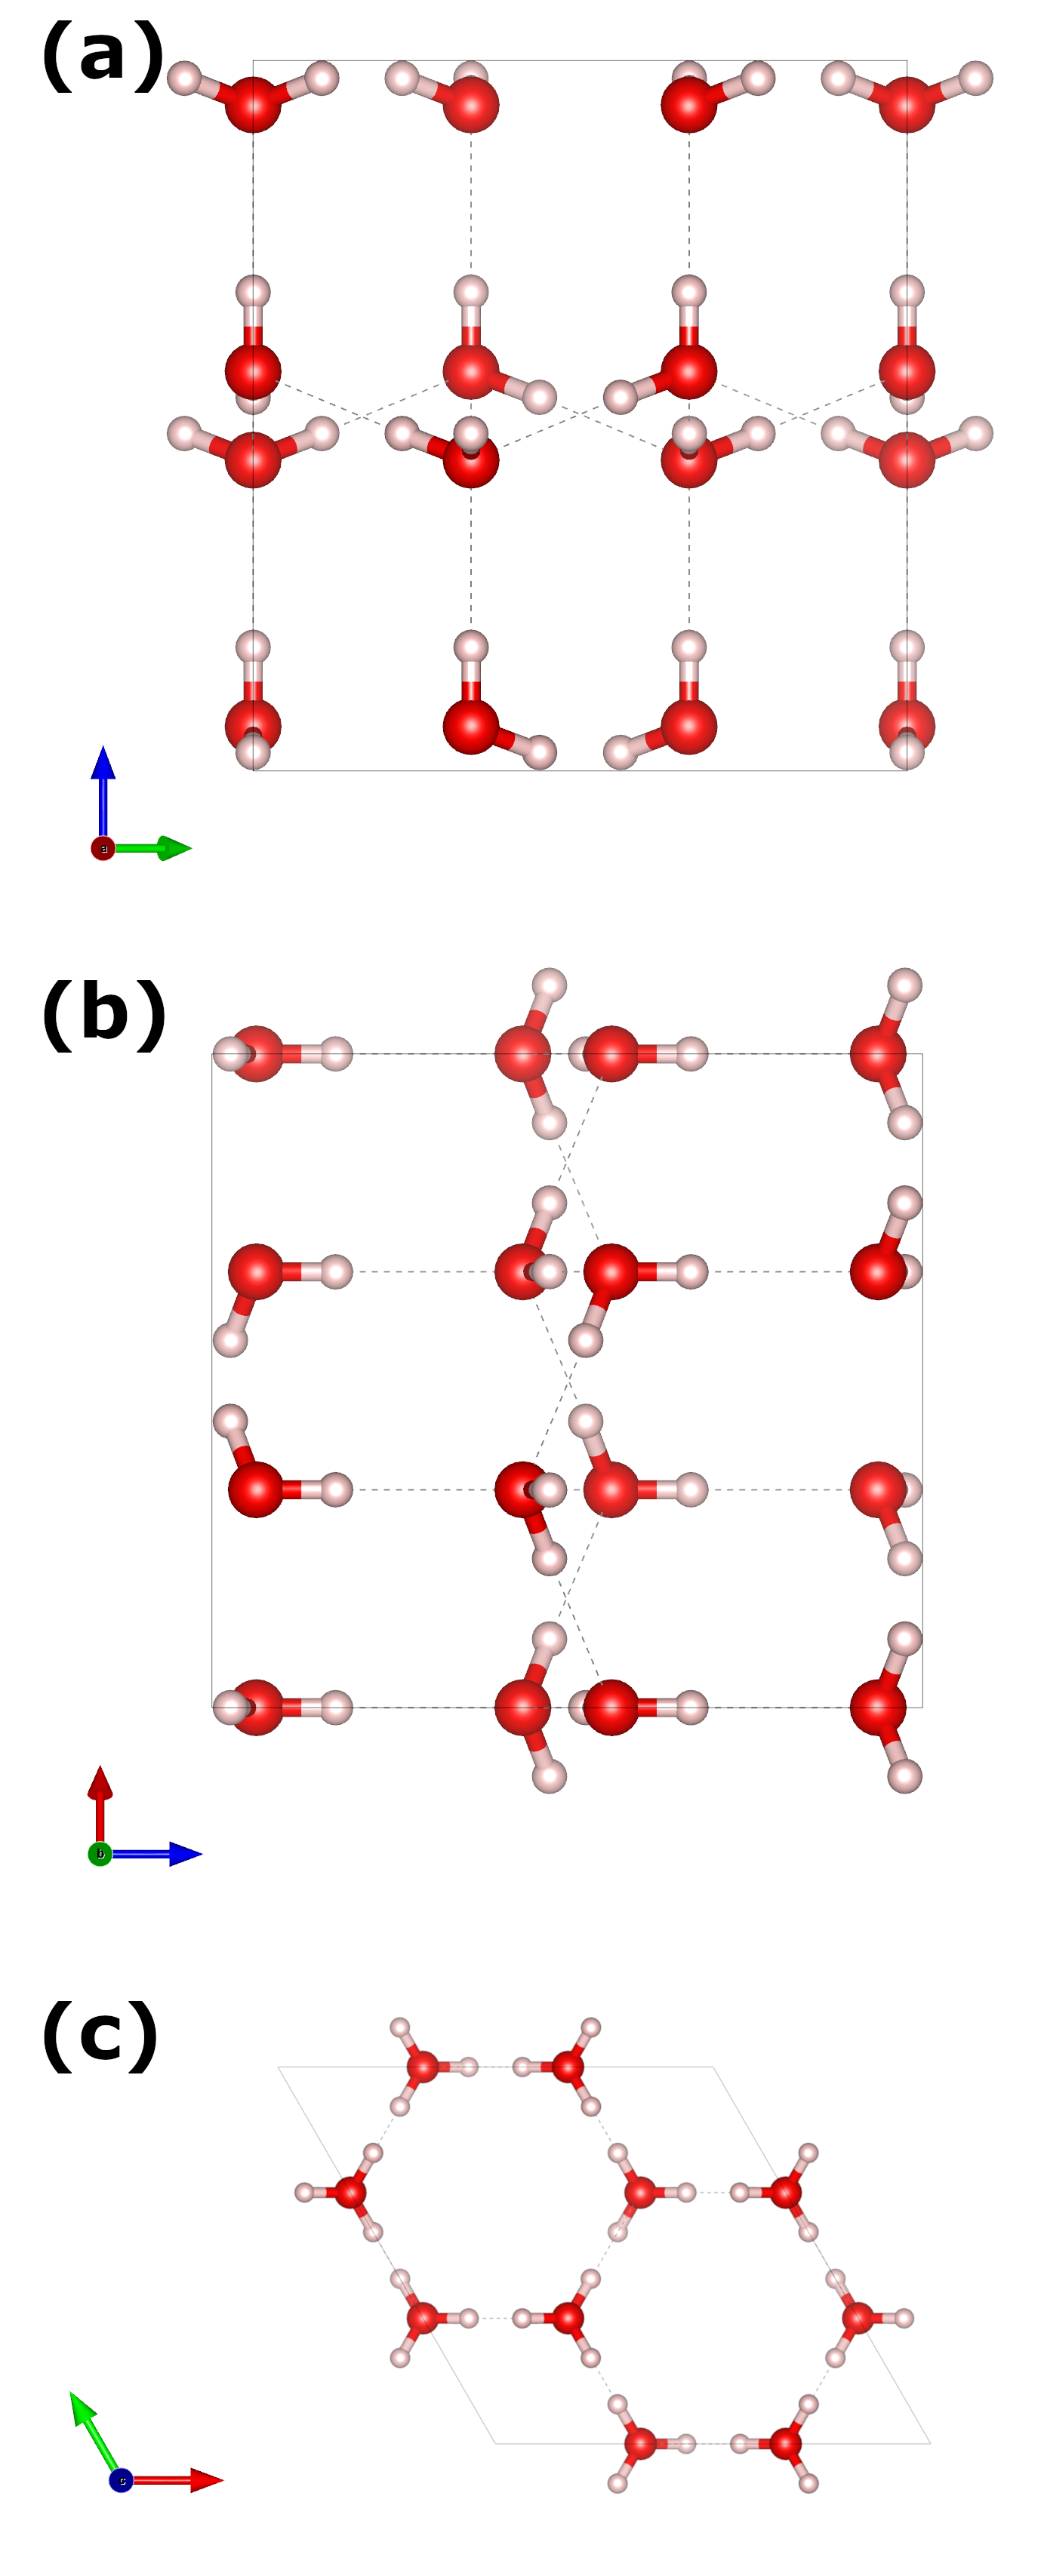
Figure 2: Visualization of studied ice Ic unit.
Author Ran
LastMod 2023-01-04