fist drag issue finally solved
Contents
After fixing the boundary condition and drag issue, the simulation is
done and the drag history is shown in Fig. 1. The mean drag is very
close. The y-axis is at the scale of \(10^5\), so there must be a unit
conversion I was missing in the calculation.
convertToMeters 1; should be used as convertToMeters 0.001; to do
the unit conversion because the model is in a unit of a millimetre.
So, the drag coefficient should be 0.19874? The next question is how
can I verify this.
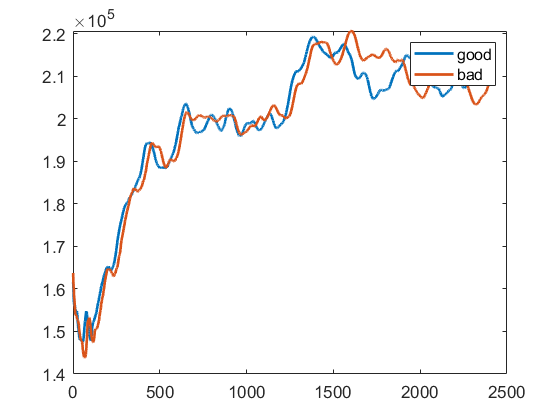
Figure 1: Using two ways yeild similar mean drag
| |
Author Ran
LastMod 2023-01-28